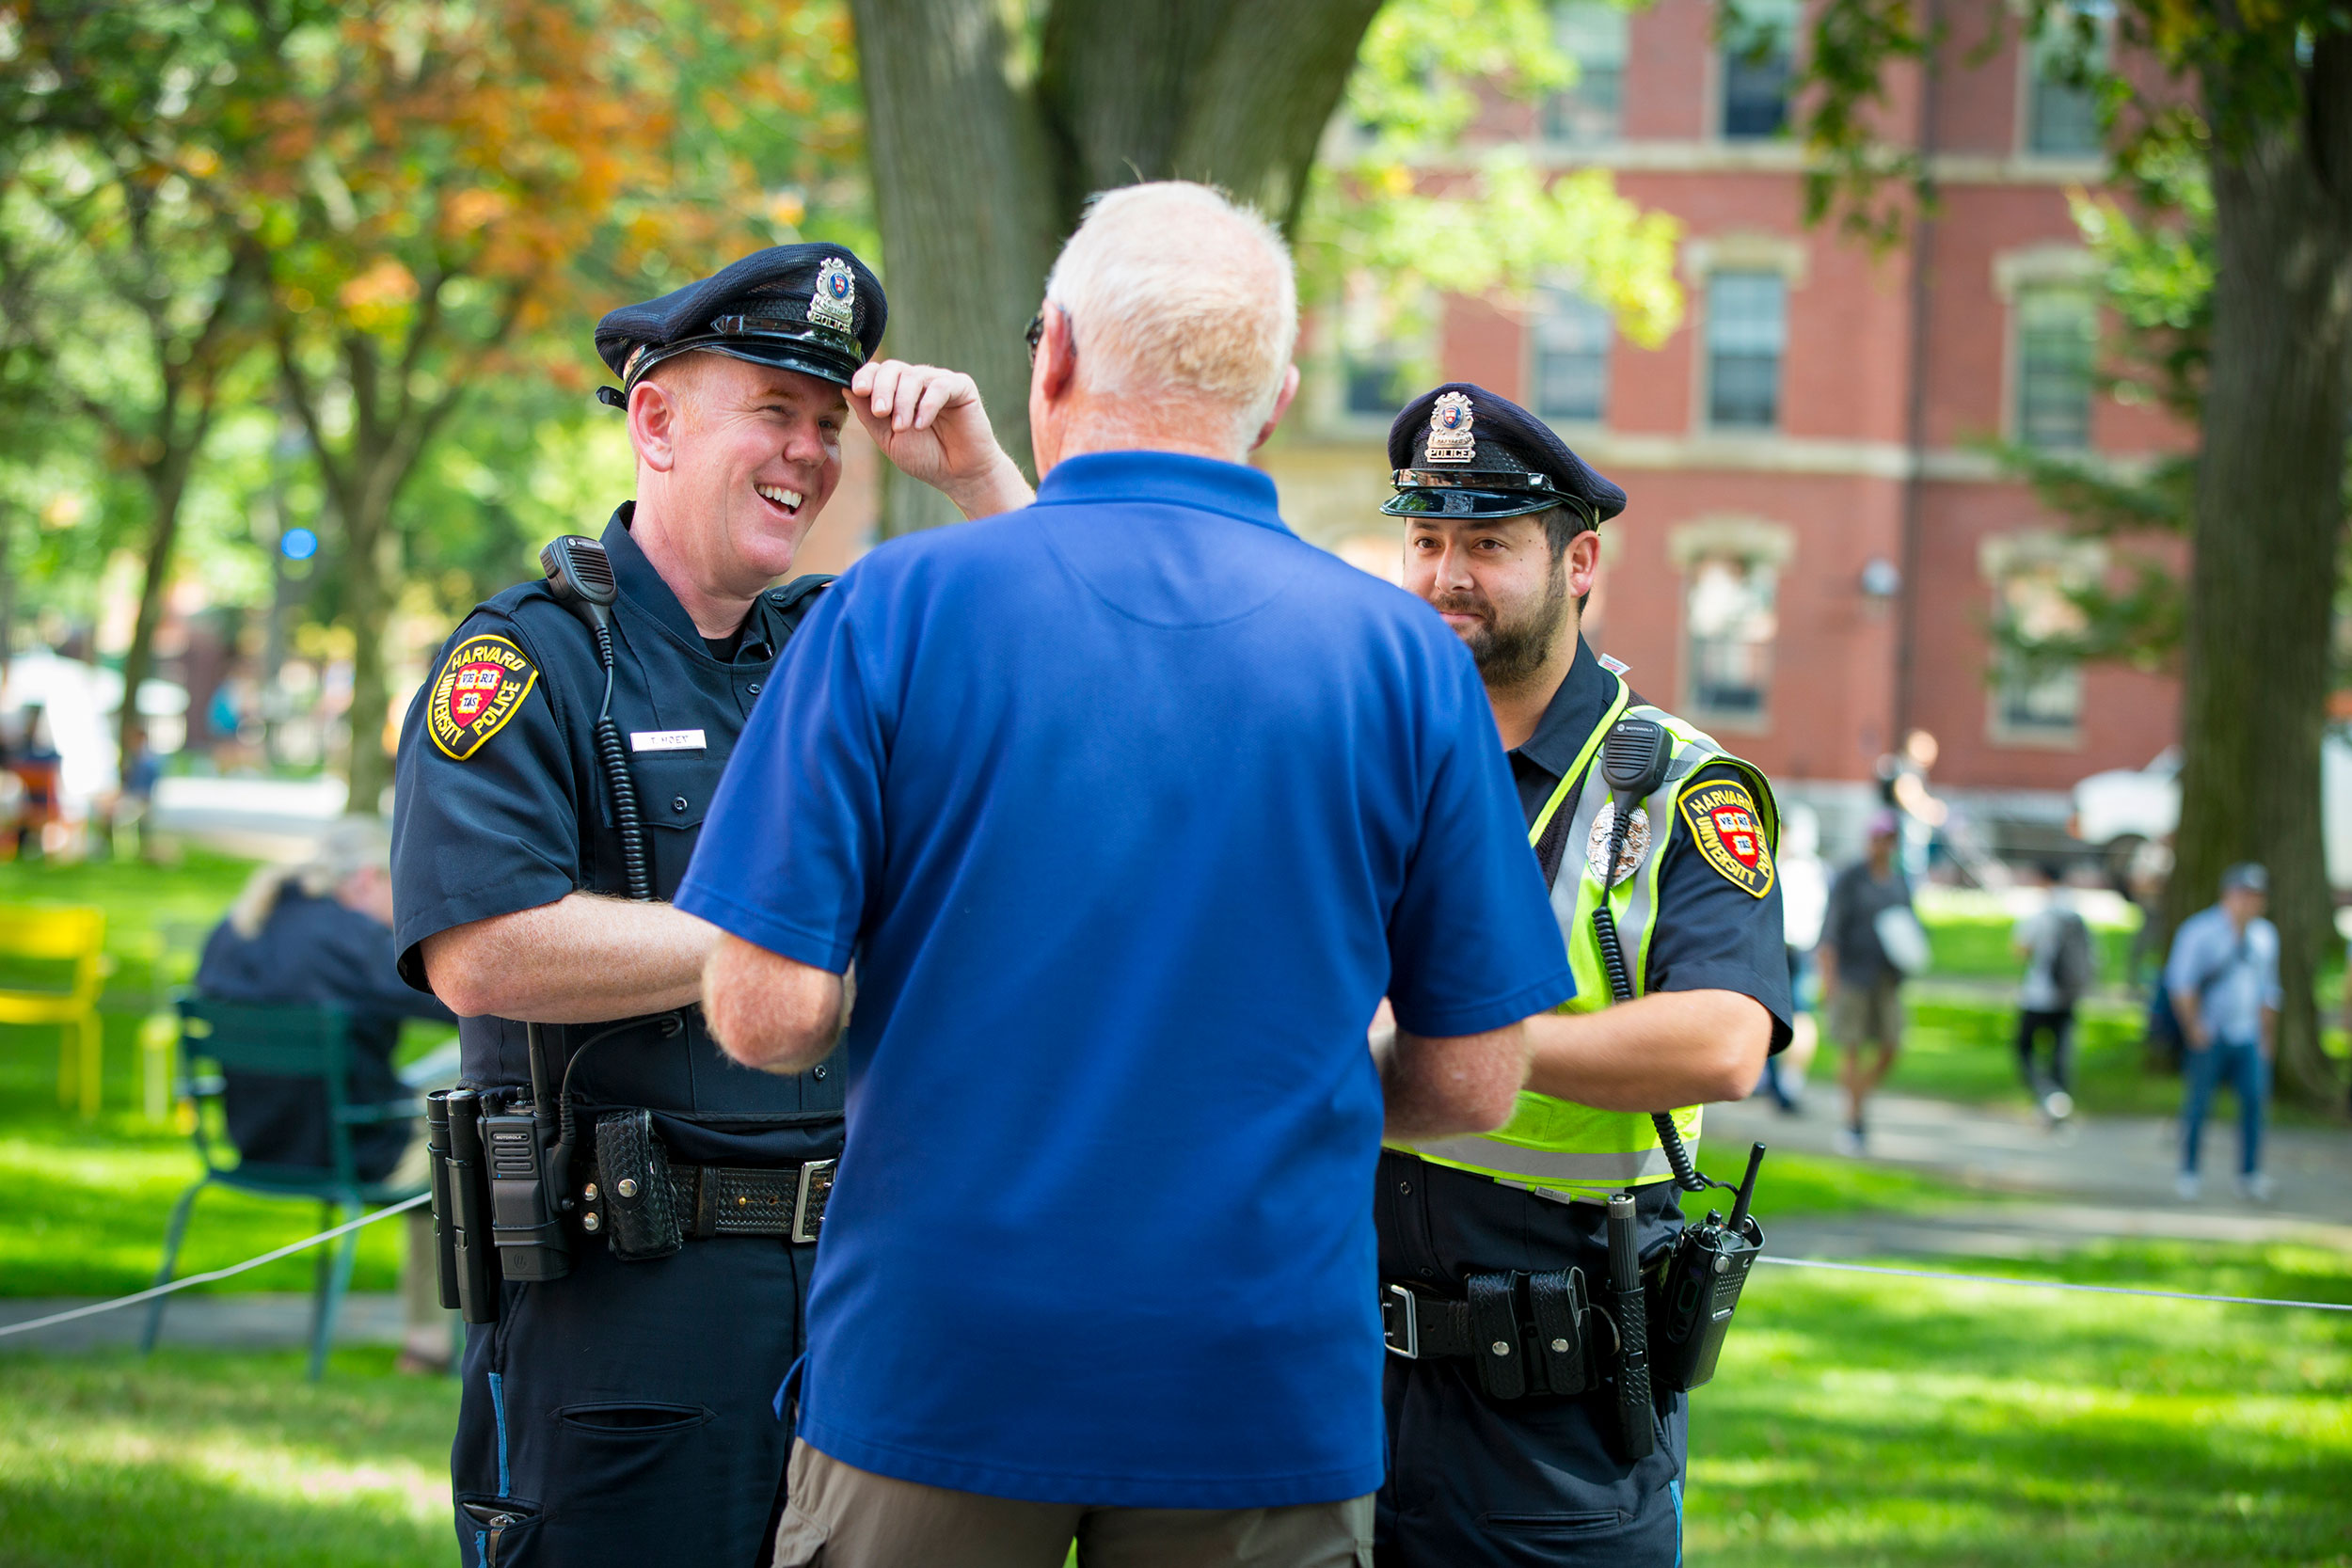
The majority of the calls received by the HUPD are for services, such as alarms, medical, or recovered property.
Harvard file photo
HUPD releases updates to dashboard reporting department data, indicators
Launched in 2021, dashboard provides greater transparency into public safety activities of the department
Harvard University Police Department (HUPD) today released the latest update to its dashboard, a website dedicated to documenting departmental statistics and other indicators regarding its interactions with the Harvard community and the public.
Originally launched in June of 2021, the dashboard was among the recommendations that were released following a Harvard-initiated, independent review of HUPD completed in 2020 by 21CP Solutions. The review included a focus on internal practices and procedures within HUPD, as well as its interactions with members of the community.
According to HUPD Chief Victor Clay, the dashboard, including these latest updates, is an integral part of the department’s commitment to a culture of transparency and accountability throughout HUPD and with the wider Harvard community.
“Every member of the HUPD team takes our responsibility for the safety of our community very seriously,” Clay said. “Transparency, and with that trust, is fundamental to our ability to fulfill this responsibility. And this dashboard is one aspect of our commitment to transparency, so our community can see what we’re doing, can gauge how we’re doing, and provide us feedback on what we are doing well and what we can be doing better.”
The latest updates to the dashboard include new sections reporting aggregated data on service calls, field stops and use of force, which provides a further breakdown by gender, age, affiliation, and race/ethnicity. Data on personnel complaints is also included. Since the initial launch, HUPD has continued to engage with members of the community, including faculty and staff from various departments across the University, along with external subject-matter experts to review the data, receive critical feedback, and ensure the information is presented in the most effective manner possible.
“… [T]his dashboard is one aspect of our commitment to transparency, so our community can see what we’re doing, can gauge how we’re doing, and provide us feedback on what we are doing well and what we can be doing better.”
Victor Clay, HUPD chief
A key partner, according to Clay, has been staff in Harvard’s Office of Institutional Research and Analytics (OIRA), who provided guidance on best practices in data synthesis and translation, and recommendations on presenting data in a format most compatible with public consumption.
Shea Cronin, assistant professor of criminal justice at Boston University (BU) and vice chair of BU’s Community Safety Advisory Group, says having data available to the public is key to fostering a sense of agency in various stakeholders concerned about safety.
“When it comes to understanding public safety concerns, they need information so they can also work with police to figure out better ways to address any concerns in an effective way,” Cronin said. “It helps anybody who is concerned about issues on campus to advocate for whatever changes they see fit.”
Another recommendation of the 21CP Solutions review was the creation of an advisory board, to allow for a diverse group of community stakeholders to provide guidance, direction, and feedback relative to how well the HUPD is serving the community. That advisory board, Clay said, has also been a critical partner in providing consistent feedback to HUPD at various stages in the updates to the dashboard.
“The dashboard is about transparency, but along with that is also creating more awareness of how HUPD approaches its work, what actions and activities are a part of its work and what are the outcomes of the work,” said Tim Bowman, dean of administration and finance at Harvard School of Engineering and Applied Sciences and the HUPD Advisory Board chair. “An example of that is raising the understanding of what a service call is, how they’re initiated, and how HUPD officers respond. In addition to reporting the data, the dashboard provides important context to what these actions are, and in doing so help us — as a community and as an advisory body — identify ways HUPD can do better.”
“The dashboard is about transparency, but along with that is also creating more awareness of how HUPD approaches its work, what actions and activities are a part of its work, and what are the outcomes of the work.”
Tim Bowman, HUPD Advisory Board chair
Regarding calls for service to HUPD, the updated dashboard data indicate that the majority (59 percent) between 2020 and 2022, were service-related (e.g., alarm, medical, found/recovered property) rather than direct responses to crime or reported crime.
Several other new sections document information and actions taken as part of a response to a call for service, including sections on field stops (when an officer approaches an individual due to the suspicion that a crime has occurred or is actively occurring) and use of force. Of the 319 total HUPD field stops between 2020 and 2022, the majority — 83 percent — resulted from calls from the community, meaning the calls came from visitors, community members, or other police agencies. The remaining 17 percent were initiated by an HUPD officer.
Only 3 percent of calls for service involved any type of enforcement action, such as a field stop, an arrest, or criminal complaint, and less than 1 percent involved use of force by an HUPD officer. Use of force is defined as any action taken to control a situation beyond verbal persuasion.
“One of the real strengths of this dashboard is it has lots of definitions and clear terminology for folks,” Cronin said. “It uses language that just about anybody would understand, in terms of what an arrest is, what a criminal complaint is.”
With these latest sections now in place, HUPD has set the goal of updating the dashboard annually.


